
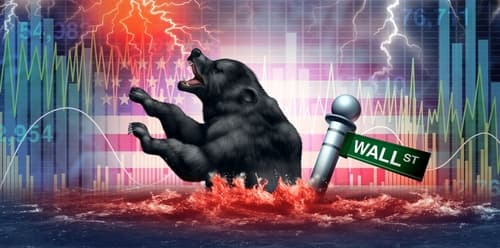
Markets got their October surprise – just in time for Halloween.
On Friday, the stock market had its worst performance since June. The tech-heavy Nasdaq was hardest hit, declining 3.5% from peak to trough. For a moment on Friday afternoon, we endured a serious déjà vu of March 2000.
The day’s move came amid a near-30% drop in chipmaker Intel (INTC) and social media platform Reddit (RDDT) following earnings reports.
Market volatility jumped over 20%. Gold also sold off, dropping under $4,000.
A look at volatility futures also suggests that investors see Friday’s sell-off as a tempest in a teapot – a big fuss over something small and unimportant:

Historically, volatility futures indicate that stocks tend to rally into the end of the year, hence the drop to calm in December.
The 12-month period for markets following a midterm is among the best times to invest. The market is up 12 months out from every midterm since 1950, a 19-for-19 track record, with gains ranging anywhere from 4% to over 30%.
Of course, if you listen to any politician over the weekend, this is the most existential election in the Republic’s 237-year history. (Cue: overly dramatic Halloween music and b-roll of the 1935 classic Bride of Frankenstein.)
We want to be mindful of ongoing market volatility and growing concern over AI spending, and use our patented AI future-tracking tool to steer clear of future volatility. If you’ve missed our 12-month forecast following this year’s midterm, you can check it out right here.
In today’s Pro, Andrew recommends a curious fund that captures a substantial amount of upside in the Nasdaq, but also caps the downside… and pays out a generous yield.
~ Addison
P.S. We have gads of historical data revealing an anomaly you cannot afford to miss.
Since 1950, over 19 consecutive midterm elections, this weird forecasting trick has proven 100% correct, 100% of the time.
If you want to understand how this unique strategy can help you make money no matter which knucklehead gets elected to federal office, click here to learn more.
P.P.S. Last week, Grey Swan Live! returned with a closer look at some of the election data we’re sharing here.
History shows the S&P 500 has finished higher 12 months after every midterm election since 1950, with an average gain of 15.1%. But with bond yields rising and concerns over AI mounting, knowing what to buy — and what to avoid — is critical right now.
Friday’s special Grey Swan Live! sharing our final midterm forecasts and the moves we’d consider making now is posted on site for members to replay.

You don’t want to miss out… It’ll be one of the last chances to make any moves before next Tuesday’s midterms.