It’s not just you.
The stock market spiking to new all-time highs after a hard correction at the outset of the Iran hostilities is, well, rare.
So unusual, in fact, it’s a “12-sigma event” — meaning it’s literally off the charts:
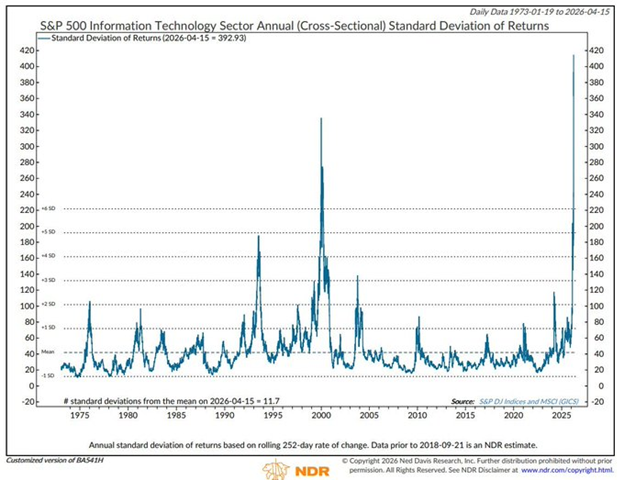
The market’s extreme move higher even outdoes the final dotcom blow-off top on March 10, 2000. The Nasdaq then fell 78% from its peak, bottoming out at 1,114 by October 9, 2002 (Source: Ned Davis Research)
In forecasting for the economy or stock market prices, “sigma” is a mathematical shorthand for “standard deviation.” It describes the level of uncertainty or “spread” around a central predicted value.
A “12-sigma event” is an occurrence so statistically rare that, under a standard normal distribution, it is effectively impossible within the lifespan of the universe.
Markets have gone from a typical “dead cat bounce” to a surge that defies the common experience of everyday investors. This rally is remarkable because it’s positive.
Historically, most atypical moves on Wall Street are painful and get a lot of headline attention:
- Black Monday (October 19, 1987): The Dow Jones fell 22.6% in a single day. While models vary based on the timeframe of data used, this is frequently cited as a 20-sigma to 25-sigma event.
- The 2008 Financial Crisis (October 13, 2008): The S&P 500 surged 11.6%, which was recorded as an 11.82-sigma positive event—nearly reaching the 12-sigma mark.
- Beyond Wall Street, even more extreme sigmas have been seen. For instance, the British Pound dropped in 15 sigma in 2020 after the Brexit vote. The Swiss Franc saw a staggering 180-sigma jump in 2015 after the Swiss National Bank removed the franc from a 1.20 peg to the euro.
The current rally on the S&P 500 Index is just the kind of rare event Grey Swan exists to identify! For an interesting way to play it, see your Shadow Stocks report in the P.S. below.
~ Addison
P.S. Yesterday on Grey Swan Live!, we showcased our latest research on Shadow Stocks – volatile stocks that move rapidly up and down beneath the surface of the calm indexes.

Earnings season is a ripe time for cherry-picking stocks. Along with the research, we are launching an upgrade to your Grey Swan forecast emails that will include up to five stock or trade recommendations a week.
To kick it off, we’re going to give you three stocks free of charge. Gratis. On the house. The research is excellent, and the upgraded Grey Swan Pro will be worth your time to consider. Take a look here.