Beneath the Surface
Let’s Plot Our Own Dots and See Where They Really Lead

September 24, 2024 • 6 minute, 9 second read
“The culprit solely responsible for inflation, the Federal Reserve, is continually engaged in raising a hue-and-cry about ‘inflation,’ for which virtually everyone else in society seems to be responsible.”
–Murray Rothbard
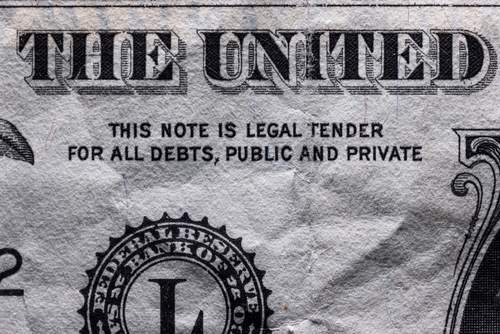
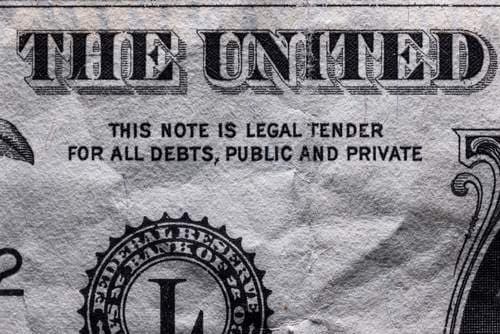
September 24, 2024 – Take a look at that blowup of the U.S. dollar. Or, if you prefer, crack open your wallet and look at one of your own.
The dollar is a “note.” In financial terms, a note is simply evidence of a debt. An IOU. When you pay for anything with a dollar, you’re simply using a note to pay a debt you own.
When you stockpile dollars, i.e., save, you’re simply saving notes. There’s no value there. The dollar used to be backed by gold, a commodity whose rarity and utility provided it with a real value.
That dollar note in your pocket is created by the Federal Reserve Bank. You can see the seal there in the blowup, or in your wallet.
Remember, the Fed likes to claim that it’s independent. It’s not part of the government. It’s a private central bank.
Congratulations, your wallet is full of private notes from a private bank. You have no money in your wallet. No asset without a counterparty.
You have evidence of a debt from a bank that can simply print more on demand to meet its needs, destroying some of what little purchasing power those notes have left.
There are a lot of mental gymnastics that we skip over every day to simply go about our business. The ephemeral nature of the dollar is one of them.
Another is one widely-followed concept from the Fed: The central bank’s “dot plot.”
The dot plot looks at how members of the Fed see interest rates trending in the months ahead:

And you thought your office fantasy league was bad.
Yet, traders rely on this information to get a sense of where interest rates will trend. Right now, the dot plot predicts that there will be two quarter-point rate cuts to wrap up 2024. And further cuts in 2025.
Frankly, these dots offer little to connect. We knew that the Fed would start cutting rates in September. And that more rate cuts would be on the way.
So instead, let’s connect our own dots today.
Dot #1: Consumers Getting Tapped Out:
Consumer spending holds up the economy. Most estimates put such spending as high as 70% of GDP. So when consumers aren’t spending, the economy tends to be in the dumps.
Consumers were flush with cash during the pandemic, fueled by stimulus checks, and the fact that so many places to spend their money were now off-limits.
Without sporting events, Taylor Swift concerts, business conferences, or even just going to the movies, savings surged.
As the pandemic-era restrictions waned, that trend reversed. It’s taken some time, and some inflation along the way. But consumers are now tapped out of savings.
In fact, our economy is now relying on the savings from foreigners to keep our economy propped up:

The trend is great while it lasts, but it can’t last forever. It appears to be nearing its end, but we likely won’t know for sure until after the holiday season. If the signs are there, the market will start to stall out in the first quarter of 2025.
Dot #2: Is the Fed Doing Too Little, Too Late?
On Thursday, we’ll get new economic data for the first time since the Fed’s 50-basis point cut last week. The durable goods data will provide some clue as to trends in GDP and inflation.
The real story is Friday’s PCE inflation. If inflation looks sticky, as it has in recent months, the central bank may be reluctant to cut interest rates too much, too fast.
But as we learned from looking at the neutral interest rate (R*), rates are likely too high for where the economy is at now.
As Global Markets Investor reports:
The central bank also reiterated that it will continue its Quantitative Tightening program – the process of reducing its balance sheet.
It appears that the Fed’s top priority now is the labor market and as we know the outlook for it is not promising.
Overall, the meeting can be assessed as historic as this decision was the most surprising for the markets and economists since 2009.
In short, the job market is deteriorating. Consumers are about tapped out. And the Fed may have to contend with inflation staying sticky.
Those aren’t great dots to connect, but it tells us more than the bank’s dot plot. We know that markets may be running on borrowed time, and that investors should get cautious following any year-end rally.
But we’re not at a market crisis quite yet.
Dot #3: Traders Aren’t Overly Leveraged – Yet
Turning to the stock market, all-time highs aren’t always a dangerous sign.
Stocks aren’t at extreme earnings levels. Even market darling Nvidia has managed to grow its share price about in-line with its earnings. So it’s not trading at an extreme valuation.
In the meantime, total margin debt – the amount of borrowed money used to buy stocks – is still about 14% below its 2021 peak:

It’s been ticking up over the past year, but has also flatlined as of July. Traders aren’t willing to increase their margin position to buy stocks here.
That’s a healthy sign for the market. It’s when trader are blindly going all-in that a Grey Swan event can lead to a big market selloff.
Adding it all up, the picture is nuanced. Consumers are slowing down, but they’re nearing a point where they’ll have to cut back on spending. The Fed’s actions may be coming too late after all, as some suspected over the summer. But traders aren’t overly leveraged going into the final months of the year.
The picture the dots connect aren’t as pretty as what the Fed is selling right now. And we expect the trend to get worse.
We suspect that Thursday and Friday’s data will give us more dots to connect, and make the picture we’re painting here a bit more clearly.
So it goes,
Addison Wiggin,
Grey Swan
P.S. Still think markets are safe? This morning, Fed Governor Michelle Bowman created a mini-selloff.
For reference, Bowman was the sole vote for a quarter-point rate cut last week. That marked the first dissenting vote by a member of the Fed board since 2005.
Today, she noted that she’s concerned that cutting too fast could mean resurgence of inflation. Specifically, she noted, “…that large amounts of sideline cash could be put to work as rates fall, stoking inflation.”
This is what is known as “saying the quiet part out loud.” As interest rates drop lower, that cash will likely want to seek assets with a higher prospective return, even if it’s a higher risk.
We appreciate the fact that the Fed has seven voting governors with a crowded speech schedule. It allows the truth about the economy to occasionally slip out.
Based on the data out there now, where do you think the economy is really at? Is the Fed right? Are there any dots we should also connect? Let us know at: addison@greyswanfraternity.com